Cite this issue

Increase in number of antiepileptic drugs (AEDs) during the period 1857 (year of introduction of bromide) to 1969. All compounds listed reached the market. The year of introduction refers to the first clinical trial for epilepsy. Modified from Friedlander (1986), with permission from the publisher.

VEM findings of Patient 3 (see supplementary table 1) (24-channel EEG with one channel of simultaneous ECG recorded with high frequency filter = 70 Hz, low frequency filter = 0.5 Hz, sensitivity = 10 μV/mm, and display speed = 30 mm/sec): (A) ictal onset characterized by a burst of multiple spikes followed by rhythmic spikes over the right posterior temporal region with phase reversal at T6, as illustrated by the red arrow; (B) onset of asystole after a latency of 24.1 seconds following the ictal EEG onset; and (C) diffuse slowing with attenuation of activity and asystole offset.

Patients 1-4. Left panels: 3T MRI axial T2 sequences demonstrating the locations of the temporal encephaloceles. Right panels: a selected view of the intracranial EEG, highlighting the temporal relationship between the anterior temporal region and hippocampus at the start of seizures for each respective patient (LFF: 5.3 Hz; HFF: 120 Hz; sampling rate: 500 Hz).

(A) SEEG implantation showing the electrodes on a 3D MRI mesh of the cortex (right side). Intracerebral electrodes are implanted under stereotactic conditions in Talairach's reference frame. Electrodes are identified by letter (A, etc.) and the electrode contacts are numbered from 1 to 15; low numbers corresponding to the deepest structures (for example, leads A1-2 recorded the electrical activity of the amygdala). A: Amygdala (medial contacts), and anterior part of middle temporal gyrus (MTG, lateral contacts); B, C: anterior, posterior hippocampus (medial contacts), medial, posterior part of MTG (lateral contacts); T: insula (medial contacts) and anterior part of superior temporal gyrus (STG, lateral contacts); TP: temporal pole; OF: caudate nucleus (internal contacts 1-2; operculo insular cortex); GC: cingulum (medial contacts), inferior parietal gyrus (lateral contacts); P: superior parietal cortex. (B) SEEG recorded seizure with selection of some bipolar traces. Bipolar signals were obtained by subtracting the signals recorded from two adjacent leads: 1: seizure onset marked by a rapid discharge affecting the mesial temporal region; 2: coughing onset. Note the appearance of a discharge in some other contacts (OF1-2: caudate nucleus; T1-2: insular region).

Connectivity analysis. (A) Changes in connectivity during seizure onset and during coughing; mean values over periods of 10 seconds are compared. Significant changes of connectivity are illustrated on a 3D mesh of the MRI with the position of electrodes. Only the significant changes are indicated for the seizure onset relative to the background period and for the coughing period relative to the onset. Colour scale indicates the p values of the Z-scores. (B) For each bipolar channel, the degrees are indicated between the different conditions (onset versus background and coughing versus onset) *indicates significant interactions (*p<0.05, **p<0.01 following Bonferroni correction).

Pedigree of Family 1 with a JME-like phenotype showing multiple complex consanguinity loops and six affected members in three different siblings.

Pedigree of Family 2 with a typical clinical picture of ULD showing affected members in the same siblings.


Expression profiles of CSTB, CTSB and CST3 genes. The level of transcripts of CSTB (blue), CTSB (red) and CST3 (green) was measured by quantitative RT-PCR (q-RT-PCR) in leukocytes from patients and the carrier of Family 1 (Fam1-V.17, V21, VI1 and V21) or 2 (Fam2- VI1, VI2, VI6 and V9) and compared to those of controls. Relative expression (RE) of the sample gene was calculated using the ΔΔCT method using the formula RE = 2ΔΔCT, where CT = PCR cycle in which the sample fluorescent intensity exceeds that of background, ΔCT sample = CT sample - CT ACTB sample, ΔCT control = CT control - CT ACTB control, and ΔΔCT = ΔCT sample - ΔCT control. For each tested individual, the experiment was performed in triplicate. The 2ΔCt ratio for sample:control for each gene is indicated on the y axis.


Preoperative (A-H) neuroimaging and EEG findings of the patient. Before the SE, the patient's MRI did not reveal an obvious abnormality in the brain (A). After the SE, ictal positron emission tomography (PET) showed multiple hypermetabolic foci, and the brain MRI showed multiple abnormal signals during the early stage (B, C). A preoperative scalp EEG showed generalized epileptiform discharges with maximal amplitude over bilateral frontal lobes during the interictal period and generalized onset within the ictal period. Postoperative (I-N) neuroimaging and EEG findings of the patient. Brain MRI showed multiple abnormal signals during the early stage (I) and diffusive brain atrophy (L) in the late stage. Electrode signals in the ANT and frontal lobes on brain MRI were present after ANT-DBS treatment (I, L). A post-operative interictal scalp EEG showed that the diffusive epileptiform discharges decreased after the stimulator was turned on and increased after the stimulator was turned off.

Preoperative (A-H) neuroimaging and EEG findings of the patient. Before the SE, the patient's MRI did not reveal an obvious abnormality in the brain (A). After the SE, ictal positron emission tomography (PET) showed multiple hypermetabolic foci, and the brain MRI showed multiple abnormal signals during the early stage (B, C). A preoperative scalp EEG showed generalized epileptiform discharges with maximal amplitude over bilateral frontal lobes during the interictal period and generalized onset within the ictal period. Postoperative (I-N) neuroimaging and EEG findings of the patient. Brain MRI showed multiple abnormal signals during the early stage (I) and diffusive brain atrophy (L) in the late stage. Electrode signals in the ANT and frontal lobes on brain MRI were present after ANT-DBS treatment (I, L). A post-operative interictal scalp EEG showed that the diffusive epileptiform discharges decreased after the stimulator was turned on and increased after the stimulator was turned off.

Stimulation voltage and seizure and SE frequency (upper panel) and pulse width, drugs administered, and presence of tremor (lower panel) at different times after ANT-DBS. The SE was controlled after the stimulator was turned on, but recurred after the stimulator was turned off. The patient's tremor did not improve following decreased valproate dosage or stimulation voltage and pulse width (SE: status epilepticus).

Overview of one tonic seizure with four bursts of bilateral EMG activity followed by single-unit ∼12-Hz firing. Source derivation. X axis: each division represents a second; Y axis: 250 mmV/cm.
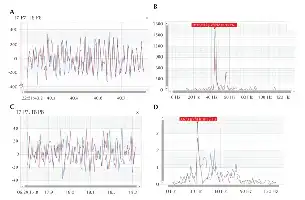
(A) EMG activity during a tonic seizure at T7-P7 and T8-P8. Note the synchronous activity between the right and left side. X axis: seconds; y axis: microvolts. (B) Frequency spectrum of the second tonic burst (Figure 1), showing peak firing at 42 Hz. For comparison, the temporal EMG plot (C) and its spectra (D) for the same electrodes during normal activity (chewing) of the patient are presented (also note the different scale of the y axis).

(A-C) Axial and coronal brain MRI showing enhanced right midbrain and a cystic lesion below the level of the red nucleus, extending to the midbrain-pons junction. After five months, MRI showed only a small level of nuanced midbrain flair hyperintensity (D-F) without enhancement (E). Ictal EEG, during hyperventilation, showed movement artefacts and myogenic potentials without paroxysmal discharges (G).